At a glance
What are short-term forecasts?
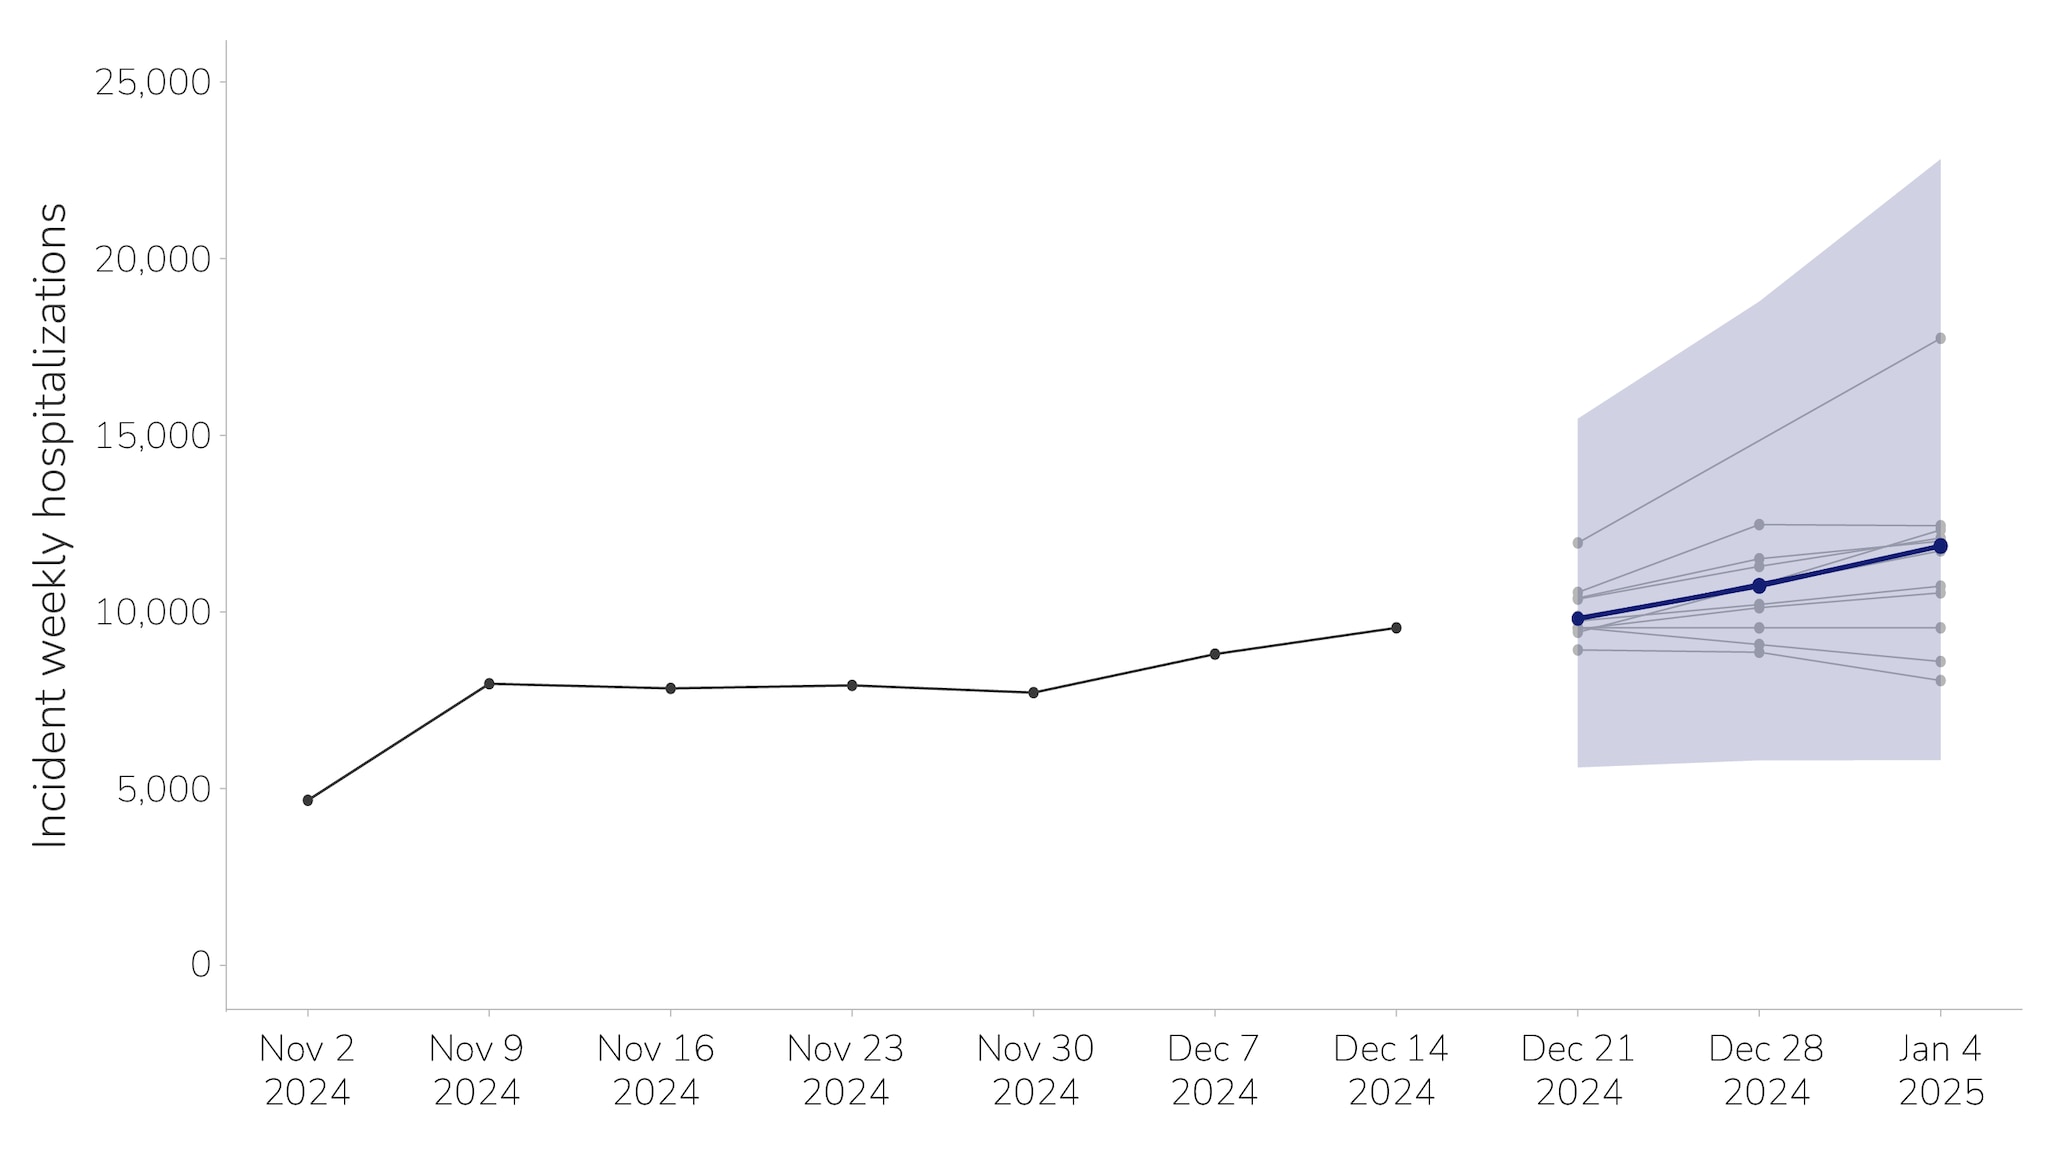
Short-term forecast models for infectious diseases predict public health outcomes—such as the number of new infections or hospital admissions—for the near future, usually the next 1–4 weeks. They also quantify the uncertainty in these predictions (Figure 1). Forecasts differ from scenario models, which often project further into the future—in the range of months or even years—to explore hypothetical situations under a range of assumptions.

These forecasts provide a look ahead at disease activity, helping to facilitate planning and preparedness activities for public health and healthcare systems. CDC has been hosting short-term forecasting challenges for more than a decade. FluSight, which CDC began in 2013, produces short-term forecasts of influenza hospital admissions. The COVID-19 Forecast Hub, which CDC has supported since March 2020, produces short-term forecasts of COVID-19 hospital admissions.
How are short-term forecasts used?
Short-term forecasts help inform a range of preparedness and response activities for public health and healthcare. For example, during the COVID-19 pandemic, short-term forecasts of new cases were used to provide situational awareness and guide the timing and intensity of non-pharmaceutical interventions and the allocation of medical resources. Forecasts of hospital admissions were used to support surge planning in healthcare systems, including procurement of consumables and equipment, timing of elective procedures, and surge staffing. Both FluSight and the COVID-19 Forecast Hub provide forecasts at the national, state, and territorial levels, enabling public health decision-makers to review predictions relevant to their jurisdictions.
How do we forecast?
Data
The COVID-19 Forecast Hub collects forecasts of COVID-19 hospital admissions for the current week and upcoming three weeks. We focus on COVID-19 hospital admissions because hospital admissions have been widely reported, and there are often sufficient numbers of hospitalizations to generate forecasts (as opposed to deaths, which are rarer). There are also potential interventions available to manage surges in hospital admissions, such as expanding staffing or delaying elective surgeries. All models submitted to the COVID-19 Forecast Hub use state-level hospital admissions data that are publicly available through the National Healthcare Safety Network (NHSN) as an input for their forecasts; some models also supplement with additional data sources, such as wastewater.
Models
Participating teams submit a probabilistic forecast for the expected number of hospital admissions, including at least 23 quantile values (e.g., 0.5, 0.975) that reflect the uncertainty of the forecast estimates. Teams submit their forecasts in a standardized format, allowing for comparison and ensembling across the different forecasts. Model outputs must pass certain quality checks such as including forecasts for the correct time period and providing quantile values. Forecasting models can be generated using two broad categories of methods: statistical models and dynamic transmission models.
Statistical models
Statistical models, such as time series or regression models, capture trends from past data to generate an estimate for current and future outcomes. Some forecasting teams submitting to the COVID-19 Hub take a straightforward approach with their statistical models, such as predicting current values based on a linear combination of past values, while others combine statistical models with machine learning approaches.
Dynamic transmission models
Dynamic transmission models build a simplified version of underlying disease transmission and disease progression processes to forecast future outcomes, such as infections or hospitalizations. Unlike statistical models, dynamic transmission models can account for variability in the way people interact with each other and how their infection statuses change over time. These models can also include more complexity than statistical models by incorporating factors such as age structure of the population, infection and vaccine history, and waning immunity. Dynamic transmission models can be compartmental or agent-based.
Why does CDC use ensemble forecasting?
CDC combines individual forecasts submitted to the COVID-19 Forecast Hub to produce the COVID-19 hub ensemble model The COVID-19 hub ensemble model is generated from all eligible underlying models to create a forecast for the current and following three weeks.
Ensemble forecasting is used because ensemble models often have better accuracy on average compared to any single model. Short-term forecasting models vary in their methods, parameters, assumptions, and input data. These variations can impact model accuracy and the degree of uncertainty in the results, and combining in an ensemble reduces the effect of any single assumption or error. However, ensemble models are still sensitive to biases and assumptions in the underlying models and data. If all model submissions make similar assumptions about the transmissibility of SARS-CoV-2, or all models use a dataset that is missing certain populations, the ensemble will reflect these biases.
CDC currently uses a median ensemble for the COVID-19 Forecast Hub, where the ensemble prediction is the median of all submitted models' predictions. Median ensembles are simple to create and can work well, but they are not the only way to combine multiple forecasts into a single prediction. Other ensembling methods involve weighting, so that models with the best track record of success contribute more to the ensemble forecast.
Evaluating Models
Forecasts from the COVID-19 Forecast Hub, including individually submitted models and the COVID-19 hub ensemble model, are evaluated for their performance. Evaluating how well a model predicts COVID-19 hospitalizations can help us identify strengths and weaknesses of models (e.g., if a model has varying performance when an epidemic is growing vs. not changing vs. declining) and inform model changes that can enhance performance. All forecast models tend to have more accuracy in the near future, and higher uncertainty as we predict further into the future.
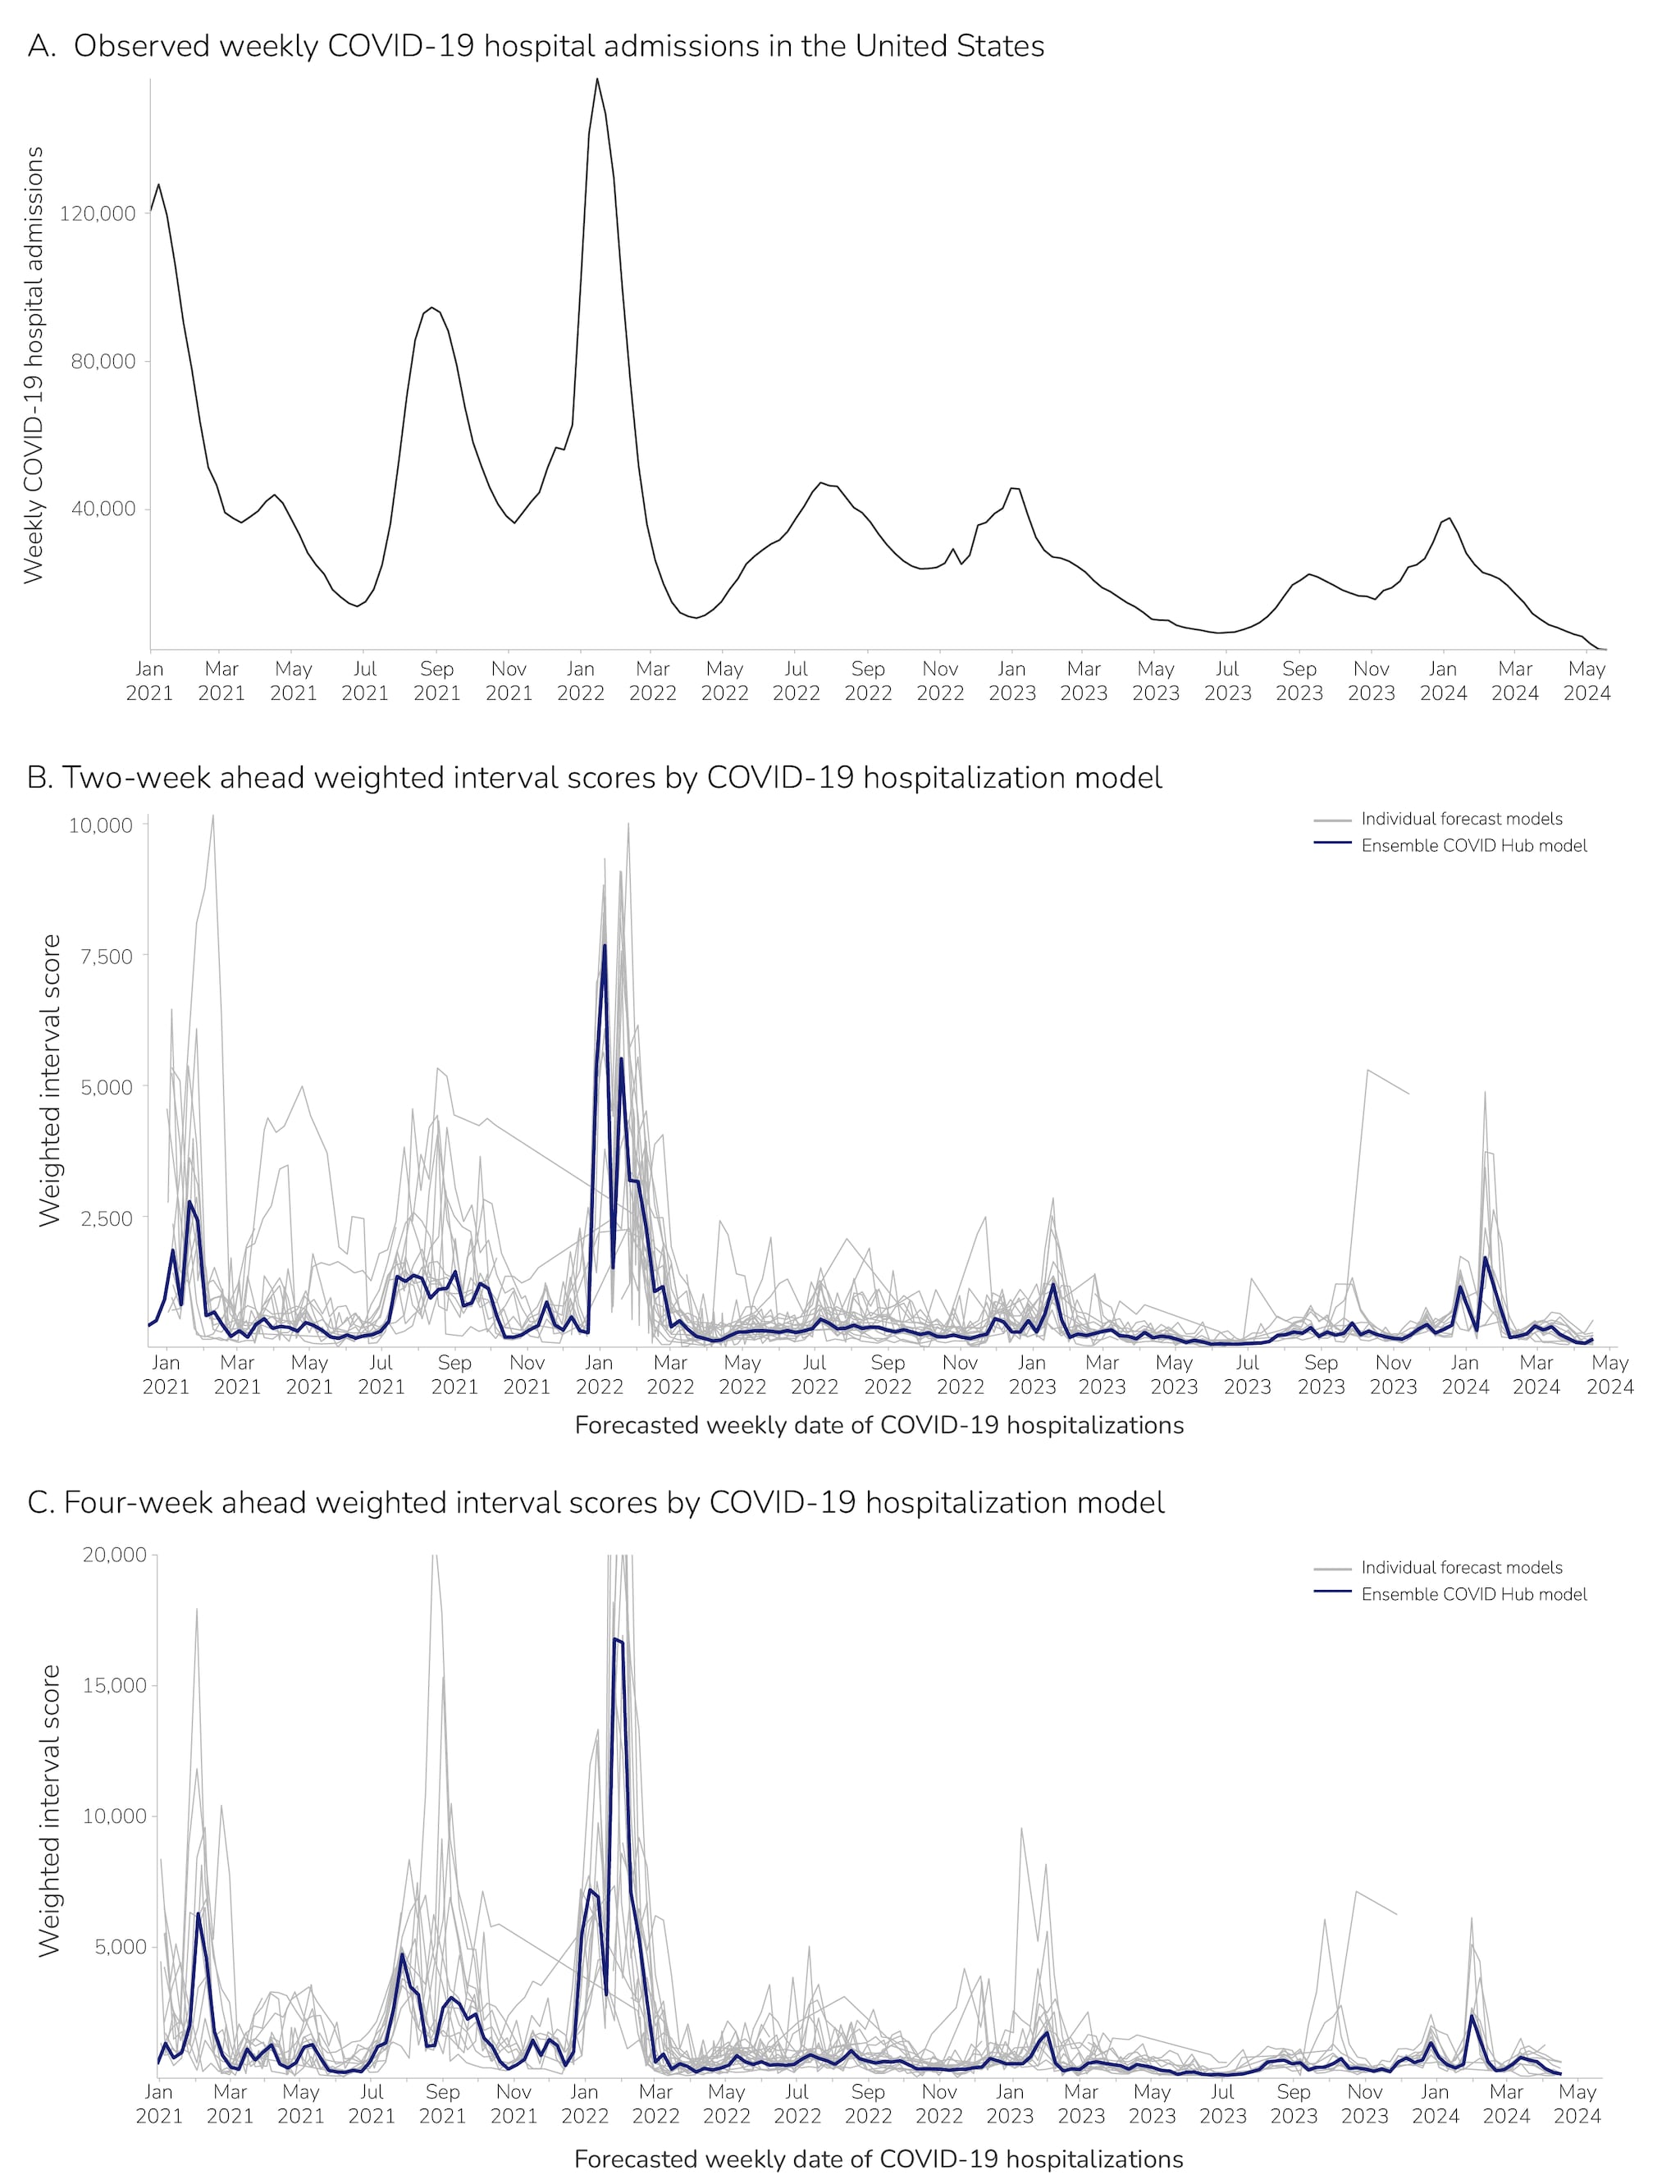
One way to evaluate model performance is using weighted interval scores, which provide a measure of how accurately the forecasts predicted what was subsequently observed. Smaller weighted interval scores indicate the prediction was closer to the observed values and thus was a more accurate forecast. Figure 2 (below) plots the weighted interval score of the COVID-19 hub ensemble model (in blue) compared to the scores of models submitted to the COVID-19 hub (in grey). Though the exact score varies over time, we see that the COVID-19 hub ensemble model consistently has a relatively low weighted interval score and high accuracy compared to the individual model submissions.

At times, individual models perform better than the ensemble. This could be because the assumptions in that model might be more accurate than other submissions for a specific population, location, or timeframe. For example, if a new variant emerged and one model was explicitly accounting for this while others did not, it might perform better than the ensemble for periods of time. However, it can be difficult to predict when an individual model will perform better than the ensemble over the course of a season. In general, the ensemble is one of the most consistently accurate forecasts; we previously saw this in evaluations of ensemble and individual models for COVID-19 mortality.
Conclusions
Forecasting allows us to generate estimates of future COVID-19 hospitalizations to inform preparedness for public health and healthcare systems. Ensemble forecasts can help provide estimates that better predict actual hospitalization rates than individual models. A central hub that collates forecasts allows us to evaluate and compare different models, provides a central place to view estimates, and facilitates coordination among teams to share methods. The COVID-19 Forecast Hub allows us to leverage knowledge from teams across the country to inform national and local responses to changing numbers of COVID-19 hospitalizations.
CFA is continually working to improve forecasting methods, and the utility of these forecasts for our public health partners. If you have ideas for how the forecast hub can work better for your public health practice, let us know.
